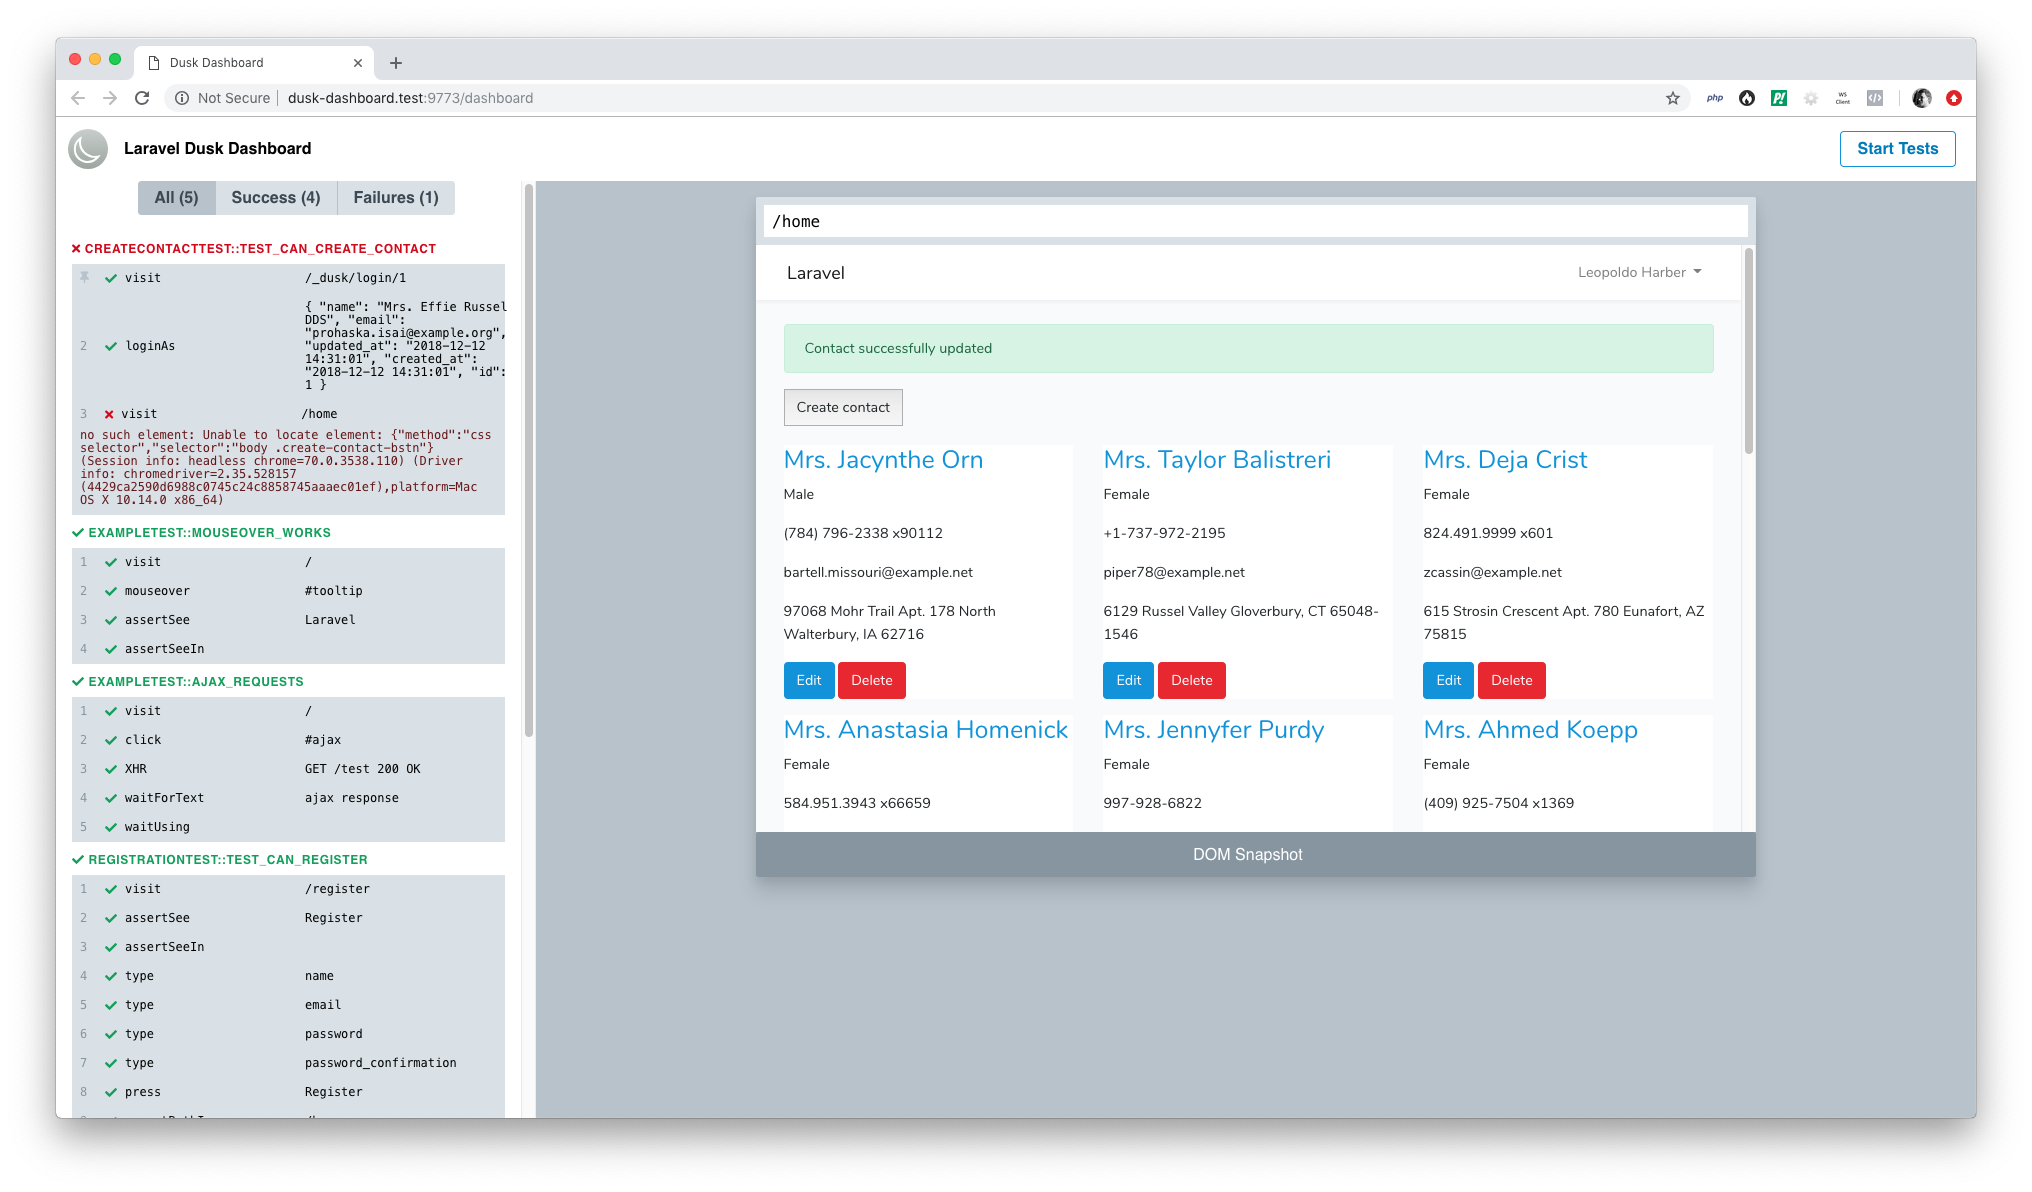
Introducing Laravel Dusk Dashboard
Laravel Dusk Dashboard is a Laravel package that gives you a beautiful Dashboard for your Dusk test suites. It completely visualizes the individual steps that are involved when your Dusk tests are running, as well as DOM snapshots for each individual step. This makes it super useful when trying to debug your browser tests and to figure out what they are doing in the background. You can also make use of your browsers debug tools to inspect the DOM snapshots.
In addition to the UI Dashboard, this package also comes with a Laravel Dusk test watcher, that will automatically run your Dusk tests whenever you make changes to your tests.
The package is highly inspired by Cypress, a Javascript frontend-testing framework.
You can check out the package on GitHub.
What is Laravel Dusk? #
Laravel Dusk provides an expressive, easy-to-use browser automation and testing API. With Laravel Dusk, you can write tests for your application that require a real browser. For example when you want to test drag and drop functionality on your website, want to test Vue components or other Javascript related features, that you can not test by using Laravels HTTP testing API itself.
I think that Laravel Dusk is a really great package and simplifies browser testing a lot.
Here's an example test of a user registration, so that you can get an idea of what Laravel Dusk is capable of:
public function test_can_register()
{
    $faker = Factory::create();

    $this->browse(function($browser) use ($faker) {
        $password = $faker->password(9);

        $browser->visit('/register')
            ->assertSee('Register')
            ->type('name', $faker->name)
            ->type('email', $faker->safeEmail)
            ->type('password', $password)
            ->type('password_confirmation', $password)
            ->press('Register')
            ->assertPathIs('/home');
    });
}
To learn more about Laravel Dusk and how to get started with your own browser tests, check out the official documentation.
Using Laravel Dusk Dashboard #
Before I'm going to explain how the Dusk dashboard works internally, let's take a look at how you can install and use the package in your Laravel application.
This setup assumes, that you have followed the official documentation and have successfully installed Laravel Dusk. Maybe you even have a few tests set up.
First up, require it with Composer
composer require --dev beyondcode/dusk-dashboard
Next up, you need to go to your DuskTestCase.php that was installed by Laravel Dusk. You can find this file in your tests directory.
Instead of extending from Laravel's Dusk test case, you need to extend from this package's base test case. I'll show you what happens inside of it later on.
Find and replace this line:
use Laravel\Dusk\TestCase as BaseTestCase;
with:
use BeyondCode\DuskDashboard\Testing\TestCase as BaseTestCase;
And that's it.
Now to go and start the Laravel Dusk dashboard and run your tests, start the dashboard process using:
php artisan dusk:dashboard
You should see a screen, similar to this:
Starting Tests #
To start the Laravel dusk tests, and see the output as it happens while your application is being tested, you can press the "Start Tests" button.
Once pressed, you will see all the different events of your Dusk tests coming into the dashboard.
Another way of starting the Dusk tests, is by simply editing one of your test files and saving it. The Dusk Dashboard comes with a built-in file watcher.
Debugging Test Steps #
When you want to debug/inspect individual actions in your tests, you can click on the differenct actions in the listing. One clicked, you will see a DOM snapshot representing the state of the HTML page at the time this specific action was recorded. If the action somehow possibly manipulates the DOM, you can also click on a "Before" and "After" button to toggle between the DOM Snapshots before or after the specific event took place.
Here is an example with pressing a "Register" button:
Inspecting XHR Requests #
Sometimes it might be useful to see additional information about XHR requests that took place while your tests were running. For example, you might have a button on your website, that will perform a GET request to some endpoint.
The Dusk Dashboard allows you to record XHR events as they take place and will show you the response status and the response path.

XHR request inspection is not enabled by default, as it requires you to modify the browser capabilities.
To enable XHR request logging, go to your DuskTestCase.php file. In there, there is a driver method, that sets up the WebDriver that will be used to perform the different test actions.
Since this package needs to make some adjustments to the capabilities of this driver, you need to wrap the DesiredCapabilities object with a $this->enableNetworkLogging method call.
protected function driver()
{
    $options = (new ChromeOptions)->addArguments([
        '--disable-gpu',
        '--headless',
        '--window-size=1920,1080',
    ]);

    return RemoteWebDriver::create(
        'http://localhost:9515', $this->enableNetworkLogging(
        	DesiredCapabilities::chrome()->setCapability(
            ChromeOptions::CAPABILITY, $options
        	)
        )
    );
}
By adding this, the package will enable the required capabilities to record XHR request and response information.
How it works #
The basic idea is quite simple: We setup a WebSocket server, the dashboard user connects to the WebSocket server and PHPUnit then sends out the browser events and failures to all connected WebSocket connections.
Here's how it's implemented:
Under the hood, this package adds a new StartDashboardCommand to your Laravel application.
When this command gets executed, I'm starting up a WebSocket server, powered by Ratchet. I first thought about implementing the Laravel Websockets package that I built with Freek over the last couple of weeks, but then decided against it. The reasons are quite simple: This package is only being used as a development dependency and I do not need to use Pusher / Laravels broadcasting capability, as the broadcasting happens internally via PHPUnit.
Next I add two routes to the WebSocket server.
$dashboardRoute = new Route('/dashboard', ['_controller' => new DashboardController()], [], [], null, [], ['GET']);

$this->app->routes->add('dashboard', $dashboardRoute);

$eventRoute = new Route('/events', ['_controller' => new EventController()], [], [], null, [], ['POST']);

$this->app->routes->add('events', $eventRoute);
The $dashboardRoute is the GET route that will serve as a basic HTTP controller and return the HTML view of our dashboard.
This one is pretty simple and all it does is return the HTML view:
class DashboardController extends Controller
{
    public function onOpen(ConnectionInterface $connection, RequestInterface $request = null)
    {
        $connection->send(
            str(new Response(
                200,
                ['Content-Type' => 'text/html'],
                file_get_contents(__DIR__.'/../../../resources/views/index.html')
            ))
        );
        $connection->close();
    }
}
The $eventRoute is also a HTTP route, but it uses POST and will be used to communicate between PHPUnit and our WebSocket clients.
This one is also pretty simple, because all we do here is accept the incoming POST payload and broadcast it to all connected WebSocket clients:
class EventController extends Controller
{
    public function onOpen(ConnectionInterface $conn, RequestInterface $request = null)
    {
        try {
            /*
             * This is the post payload from our PHPUnit tests.
             * Send it to the connected connections.
             */
            foreach (Socket::$connections as $connection) {
                $connection->send($request->getBody());
            }
            $conn->send(str(new Response(200)));
        } catch (Exception $e) {
            $conn->send(str(new Response(500, [], $e->getMessage())));
        }
        $conn->close();
    }
}
Collecting Browser Actions #
This was the most tedious part of the whole package. Because I want to collect all available Laravel Dusk methods and broadcast them to the WebSocket connection, I had to proxy every possible message and "collect" it.
In the custom TestCase class, that comes with this package, we can override how a new Browser instance gets created. And here's where I inject my custom Browser class that takes care of proxying the existing methods and collecting all the actions and sending them over to the WebSocket connections:
protected function newBrowser($driver)
{
    return new Browser($driver);
}
Nothing fancy. Now at first I thought about simply creating a new class, give it the base Dusk browser object and then use a magic __call method to proxy all methods. This would have saved me a lot of typing, but it would have introduced two problems:
The user loses IDE auto-complete features.
This was a show-stopper for me, as I think that this is a really important feature - especially for a testing tool. Developers do not know the API in and out and therefore need the support from their IDE.
Another problem would be that I not only want to record the DOM snapshot after the browser action took place, but in some cases I wanted to take a snapshot of the DOM before a certain action took place.
That's why I had to proxy all available Dusk methods like this:
/** @inheritdoc */
public function assertTitle($title)
{
    $this->actionCollector->collect(__FUNCTION__, func_get_args(), $this);

    return parent::assertTitle($title);
}
This allows me to collect and record the actions individually, but also to maintain IDE auto-completion. Yay!
Now the actionCollector that you can see here, is the bridge between PHPUnit and the WebSocket clients. It collects the given information, enriches it with data such as the test name and then uses the WebSocket's POST endpoint to broadcast the data:
protected function pushAction(string $name, array $payload)
{
    try {
        $this->client->post('http://127.0.0.1:'.StartDashboardCommand::PORT.'/events', [
            RequestOptions::JSON => [
                'channel' => 'dusk-dashboard',
                'name' => $name,
                'data' => $payload,
            ],
        ]);
    } catch (\Exception $e) {
        // Dusk-Dashboard Server might be turned off. No need to panic!
    }
}
Since Laravel Dusk needs to work with the Dusk Dashboard turned off as well, it's wrapped in a try-catch block so it plays nicely even when the Dusk Dashboard server is not started.
The UI #
Last but not least, this package has a lot of logic inside of it's dashboard view. It's powered by TailwindCSS and Vue to display the incoming events, filter them, etc. You can check out the code of the index view here.
And yeah, that's pretty much it!
PHP Package Development #
I am currently working on a new video course called PHP Package Development that is set to be released in early 2019. It will show you how to create your own reusable PHP packages for yourself, your company or for the whole world on GitHub.
If you are interested in learning more about PHP and Laravel package design, be sure to sign up and get notified when the course launches, as well as receive a launch discount code.